Available for Google Docs & Google Sheets!
Automatically collects data from revision history and comments to create a visual dashboard with very useful information. Now you will know who’s working hard and who’s the lazy 🙂
Features:
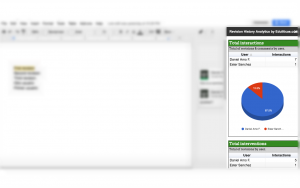
– Visualize number of interactions (edits and comments) in table format.
– Order data by user or number of interactions.
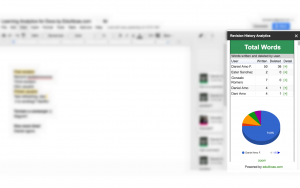
– Visualize charts of the interactions.
– Zoom option to enlarge charts.
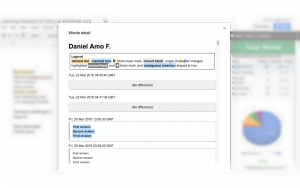
– Visualize the revision history for each user.
– Know how many words a user have written or deleted.
Post-install tip
View all analytics of interactions and comments using «Revision History Analytics > View dashboard»
Report issue
[easy-contactform id=688]


